The Challenge
Hackathon @Davos is part of the Digital Lounge during the World Economic Forum. 24 hours to develop innovative solutions for real-world problems – typically in teams of 2-3 people.
My challenge came from JiVS, a provider of enterprise migration software. The problem: Their powerful migration engine produces complex, matrix-like data in Excel format. No problem for experienced consultants – but a real hurdle for new employees or stakeholders who need to quickly understand the status.
The task: Build a visual companion application that makes migration data understandable and interactive – without replacing the power of the existing solution.
My Approach: AI as a UX Accelerator
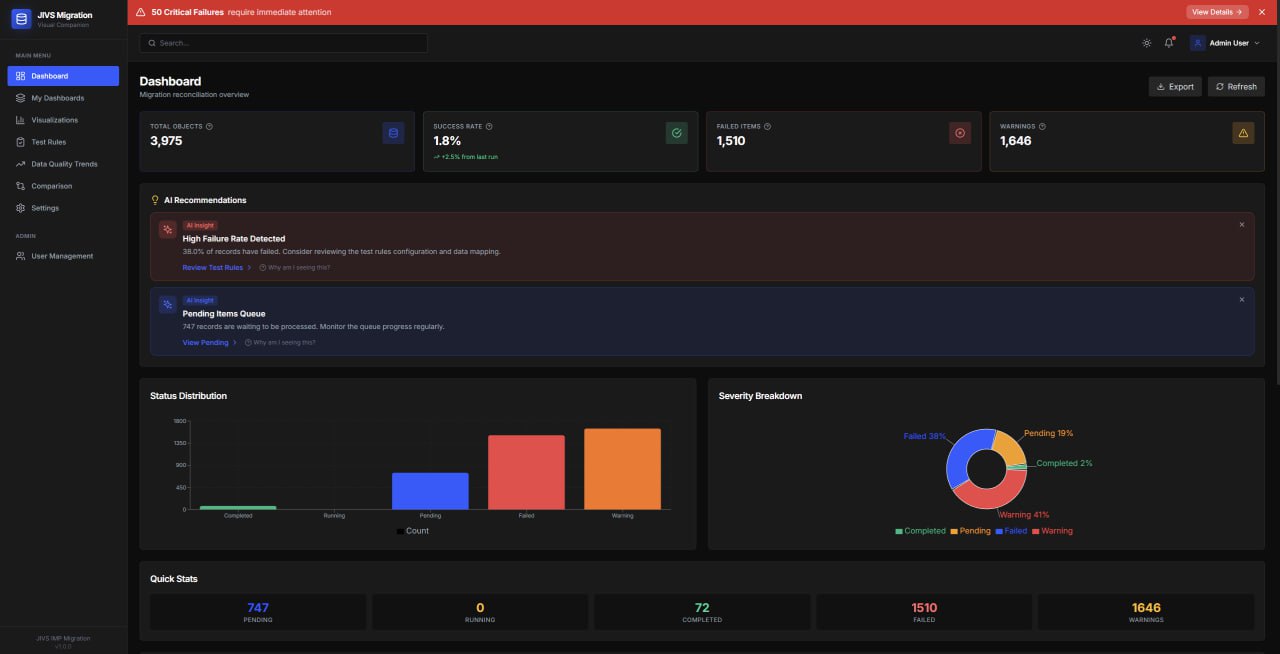
Instead of just building pretty charts, I wanted to go a step further. My vision: A dashboard that doesn't just show data, but explains it.
The core idea: AI-powered recommendations that automatically flag problems. The user doesn't have to dig through the data – the system tells them where things are broken.
Key Features
AI Recommendations
GPT-4o analyzes migration data and provides proactive hints like "High failure rate detected" or "747 items waiting for processing."
Natural Language Visualization
Users can create charts via text input: "Show me failed records by object type as a pie chart."
Trend Analysis & Predictions
Visualize historical data quality and generate AI-based forecasts for future developments.
Multi-Format Export
Export data and dashboards as PDF, CSV, or JSON – for reports and stakeholder communication.
The Tech Stack
24 hours isn't much time. I relied on proven tools that I know well:
| Component | Technology |
|---|---|
| Frontend | React 18 + Vite |
| Styling | Tailwind CSS + Framer Motion |
| Charts | Recharts |
| Backend | Node.js + Express |
| Database | SQLite |
| AI Integration | OpenAI GPT-4o |
| Auth | JWT |
The result: A complete full-stack application with ~8,000 data records, user management, persistent dashboards, and AI features.
What Convinced the Jury
The evaluation particularly highlighted the code quality. At hackathons, you often see quick-and-dirty solutions – understandable given the time pressure. I deliberately focused on clean architecture:
- Clear separation: Frontend, backend, services, routes – everything in its place
- Documentation: README with setup instructions, API endpoints, architecture diagram
- Production-ready: Docker Compose, environment variables, CI/CD pipeline
- UX details: Tooltips, loading states, error handling, dark/light mode
Jury Feedback
"Impressive code maturity for a 24-hour project. The AI integration doesn't feel like a gimmick but brings real value for less experienced users."
Learnings: Solo Hackathon as a Remote Participant
It was my first time as a solo participant at a hackathon designed for teams. A few insights:
✅ What worked well
- No coordination needed – I could set my own pace
- No context-switching between different work styles
- Full control over architecture decisions
- Remote = no travel time, own setup, own coffee
❌ What was missing
- No sparring partner for ideas
- Fatigue hits harder without team energy
- Less scope possible than with 2-3 people
- The Davos atmosphere and networking
Conclusion
The hackathon reminded me once again: Under time pressure, the most interesting solutions often emerge. Sometimes you need exactly these constraints to focus on what matters.
And the project had a follow-up: the hackathon sparked my ongoing work with DMI — AI integrations on their JiVS IMP platform, from agentic migration prep to LLM-backed data access. A 24-hour prototype turned into real engineering work.
If you have similar challenges – making complex data understandable, building dashboards for enterprise applications, integrating AI meaningfully – feel free to reach out.
Need to Make Complex Data Understandable?
I build dashboards and visualizations that non-technical users can actually understand. With or without AI.
Discuss Your Project